Quantum Market Analyzer X7Quantum Market Analyzer X7 - Complete Study Guide
Table of Contents
1. Overview
2. Indicator Components
3. Signal Interpretation
4. Live Market Analysis Guide
5. Best Practices
6. Limitations and Considerations
7. Risk Disclaimer
________________________________________
Overview
The Quantum Market Analyzer X7 is a comprehensive multi-timeframe technical analysis indicator that combines traditional and modern analytical methods. It aggregates signals from multiple technical indicators across seven key analysis categories to provide traders with a consolidated view of market sentiment and potential trading opportunities.
Key Features:
• Multi-Indicator Analysis: Combines 20+ technical indicators
• Real-Time Dashboard: Professional interface with customizable display
• Signal Aggregation: Weighted scoring system for overall market sentiment
• Advanced Analytics: Includes Order Block detection, Supertrend, and Volume analysis
• Visual Progress Indicators: Easy-to-read progress bars for signal strength
________________________________________
Indicator Components
1. Oscillators Section
Purpose: Identifies overbought/oversold conditions and momentum changes
Included Indicators:
• RSI (14): Relative Strength Index - momentum oscillator
• Stochastic (14): Compares closing price to price range
• CCI (20): Commodity Channel Index - cycle identification
• Williams %R (14): Momentum indicator similar to Stochastic
• MACD (12,26,9): Moving Average Convergence Divergence
• Momentum (10): Rate of price change
• ROC (9): Rate of Change
• Bollinger Bands (20,2): Volatility-based indicator
Signal Interpretation:
• Strong Buy (6+ points): Multiple oscillators indicate oversold conditions
• Buy (2-5 points): Moderate bullish momentum
• Neutral (-1 to 1 points): Balanced conditions
• Sell (-2 to -5 points): Moderate bearish momentum
• Strong Sell (-6+ points): Multiple oscillators indicate overbought conditions
2. Moving Averages Section
Purpose: Determines trend direction and strength
Included Indicators:
• SMA: 10, 20, 50, 100, 200 periods
• EMA: 10, 20, 50 periods
Signal Logic:
• Price >2% above MA = Strong Buy (+2)
• Price above MA = Buy (+1)
• Price below MA = Sell (-1)
• Price >2% below MA = Strong Sell (-2)
Signal Interpretation:
• Strong Buy (6+ points): Price well above multiple MAs, strong uptrend
• Buy (2-5 points): Price above most MAs, bullish trend
• Neutral (-1 to 1 points): Mixed MA signals, consolidation
• Sell (-2 to -5 points): Price below most MAs, bearish trend
• Strong Sell (-6+ points): Price well below multiple MAs, strong downtrend
3. Order Block Analysis
Purpose: Identifies institutional support/resistance levels and breakouts
How It Works:
• Detects historical levels where large orders were placed
• Monitors price behavior around these levels
• Identifies breakouts from established order blocks
Signal Types:
• BULLISH BRK (+2): Breakout above resistance order block
• BEARISH BRK (-2): Breakdown below support order block
• ABOVE SUP (+1): Price holding above support
• BELOW RES (-1): Price rejected at resistance
• NEUTRAL (0): No significant order block interaction
4. Supertrend Analysis
Purpose: Trend following indicator based on Average True Range
Parameters:
• ATR Period: 10 (default)
• ATR Multiplier: 6.0 (default)
Signal Types:
• BULLISH (+2): Price above Supertrend line
• BEARISH (-2): Price below Supertrend line
• NEUTRAL (0): Transition period
5. Trendline/Channel Analysis
Purpose: Identifies trend channels and breakout patterns
Components:
• Dynamic trendline calculation using pivot points
• Channel width based on historical volatility
• Breakout detection algorithm
Signal Types:
• UPPER BRK (+2): Breakout above upper channel
• LOWER BRK (-2): Breakdown below lower channel
• ABOVE MID (+1): Price above channel midline
• BELOW MID (-1): Price below channel midline
6. Volume Analysis
Purpose: Confirms price movements with volume data
Components:
• Volume spikes detection
• On Balance Volume (OBV)
• Volume Price Trend (VPT)
• Money Flow Index (MFI)
• Accumulation/Distribution Line
Signal Calculation: Multiple volume indicators are combined to determine institutional activity and confirm price movements.
________________________________________
Signal Interpretation
Overall Summary Signals
The indicator aggregates all component signals into an overall market sentiment:
Signal Score Range Interpretation Action
STRONG BUY 10+ Overwhelming bullish consensus Consider long positions
BUY 4-9 Moderate to strong bullish bias Look for long opportunities
NEUTRAL -3 to 3 Mixed signals, consolidation Wait for clearer direction
SELL -4 to -9 Moderate to strong bearish bias Look for short opportunities
STRONG SELL -10+ Overwhelming bearish consensus Consider short positions
Progress Bar Interpretation
• Filled bars indicate signal strength
• Green bars: Bullish signals
• Red bars: Bearish signals
• More filled bars = stronger conviction
________________________________________
Live Market Analysis Guide
Step 1: Initial Assessment
1. Check Overall Summary: Start with the main signal
2. Verify with Component Analysis: Ensure signals align
3. Look for Divergences: Identify conflicting signals
Step 2: Timeframe Analysis
1. Set Appropriate Timeframe: Use 1H for intraday, 4H/1D for swing trading
2. Multi-Timeframe Confirmation: Check higher timeframes for trend context
3. Entry Timing: Use lower timeframes for precise entry points
Step 3: Signal Confirmation Process.
For Buy Signals:
1. Oscillators: Look for oversold conditions (RSI <30, Stoch <20)
2. Moving Averages: Price should be above key MAs
3. Order Blocks: Confirm bounce from support levels
4. Volume: Check for accumulation patterns
5. Supertrend: Ensure bullish trend alignment.
For Sell Signals:
1. Oscillators: Look for overbought conditions (RSI >70, Stoch >80)
2. Moving Averages: Price should be below key MAs
3. Order Blocks: Confirm rejection at resistance levels
4. Volume: Check for distribution patterns
5. Supertrend: Ensure bearish trend alignment.
Step 4: Risk Management Integration
1. Signal Strength Assessment: Stronger signals = larger position size
2. Stop Loss Placement: Use Order Block levels for stops
3. Take Profit Targets: Based on channel analysis and resistance levels
4. Position Sizing: Adjust based on signal confidence
________________________________________
Best Practices
Entry Strategies
1. High Conviction Entries: Wait for STRONG BUY/SELL signals
2. Confluence Trading: Look for multiple components aligning
3. Breakout Trading: Use Order Block and Trendline breakouts
4. Trend Following: Align with Supertrend direction.
Risk Management
1. Never Risk More Than 2% Per Trade: Regardless of signal strength
2. Use Stop Losses: Place at invalidation levels
3. Scale Positions: Stronger signals warrant larger (but still controlled) positions
4. Diversification: Don't rely solely on one indicator.
Market Conditions
1. Trending Markets: Focus on Supertrend and MA signals
2. Range-Bound Markets: Emphasize Oscillator and Order Block signals
3. High Volatility: Reduce position sizes, widen stops
4. Low Volume: Be cautious of breakout signals.
Common Mistakes to Avoid
1. Signal Chasing: Don't enter after signals have already moved significantly
2. Ignoring Context: Consider overall market conditions
3. Overtrading: Wait for high-quality setups
4. Poor Risk Management: Always use appropriate position sizing
________________________________________
Limitations and Considerations
Technical Limitations
1. Lagging Nature: All technical indicators are based on historical data
2. False Signals: No indicator is 100% accurate
3. Market Regime Changes: Indicators may perform differently in various market conditions
4. Whipsaws: Possible in choppy, sideways markets.
Optimal Use Cases
1. Trending Markets: Performs best in clear trending environments
2. Medium to High Volatility: Requires sufficient price movement for signals
3. Liquid Markets: Works best with adequate volume and tight spreads
4. Multiple Timeframe Analysis: Most effective when used across different timeframes.
When to Use Caution
1. Major News Events: Fundamental analysis may override technical signals
2. Market Opens/Closes: Higher volatility can create false signals
3. Low Volume Periods: Signals may be less reliable
4. Holiday Trading: Reduced participation affects signal quality
________________________________________
Risk Disclaimer
IMPORTANT LEGAL DISCLAIMER FROM aiTrendview
WARNING: TRADING INVOLVES SUBSTANTIAL RISK OF LOSS
This Quantum Market Analyzer X7 indicator ("the Indicator") is provided for educational and informational purposes only. By using this indicator, you acknowledge and agree to the following terms:
No Investment Advice
• The Indicator does NOT constitute investment advice, financial advice, or trading recommendations
• All signals generated are based on historical price data and mathematical calculations
• Past performance does not guarantee future results
• No representation is made that any account will achieve profits or losses similar to those shown.
Risk Acknowledgment
• TRADING CARRIES SUBSTANTIAL RISK: You may lose some or all of your invested capital
• LEVERAGE AMPLIFIES RISK: Margin trading can result in losses exceeding your initial investment
• MARKET VOLATILITY: Financial markets are inherently unpredictable and volatile
• TECHNICAL ANALYSIS LIMITATIONS: No technical indicator is infallible or guarantees profitable trades.
User Responsibility
• YOU ARE SOLELY RESPONSIBLE for all trading decisions and their consequences
• CONDUCT YOUR OWN RESEARCH: Always perform independent analysis before making trading decisions
• CONSULT PROFESSIONALS: Seek advice from qualified financial advisors
• RISK MANAGEMENT: Implement appropriate risk management strategies
No Warranties
• The Indicator is provided "AS IS" without warranties of any kind
• aiTrendview makes no representations about the accuracy, reliability, or suitability of the Indicator
• Technical glitches, data feed issues, or calculation errors may occur
• The Indicator may not work as expected in all market conditions.
Limitation of Liability
• aiTrendview SHALL NOT BE LIABLE for any direct, indirect, incidental, or consequential damages
• This includes but is not limited to: trading losses, missed opportunities, data inaccuracies, or system failures
• MAXIMUM LIABILITY is limited to the amount paid for the indicator (if any)
Code Usage and Distribution
• This indicator is published on TradingView in accordance with TradingView's house rules
• UNAUTHORIZED MODIFICATION or redistribution of this code is prohibited
• Users may not claim ownership of this intellectual property
• Commercial use requires explicit written permission from aiTrendview.
Compliance and Regulations
• VERIFY LOCAL REGULATIONS: Ensure compliance with your jurisdiction's trading laws
• Some trading strategies may not be suitable for all investors
• Tax implications of trading are your responsibility
• Report trading activities as required by law
Specific Risk Factors
1. False Signals: The Indicator may generate incorrect buy/sell signals
2. Market Gaps: Overnight gaps can invalidate technical analysis
3. Fundamental Events: News and economic data can override technical signals
4. Liquidity Risk: Some markets may have insufficient liquidity
5. Technology Risk: Platform failures or connectivity issues may prevent order execution.
Professional Trading Warning
• THIS IS NOT PROFESSIONAL TRADING SOFTWARE: Not intended for institutional or professional trading
• NO REGULATORY APPROVAL: This indicator has not been approved by any financial regulatory authority
• EDUCATIONAL PURPOSE: Designed primarily for learning technical analysis concepts
FINAL WARNING
NEVER INVEST MONEY YOU CANNOT AFFORD TO LOSE
Trading financial instruments involves significant risk. The majority of retail traders lose money. Before using this indicator in live trading:
1. Practice on paper/demo accounts extensively
2. Start with small position sizes
3. Develop a comprehensive trading plan
4. Implement strict risk management rules
5. Continuously educate yourself about market dynamics
By using the Quantum Market Analyzer X7, you acknowledge that you have read, understood, and agree to this disclaimer. You assume full responsibility for all trading decisions and their outcomes.
Contact: For questions about this disclaimer or the indicator, contact aiTrendview through official TradingView channels only.
________________________________________
This study guide and indicator are published on TradingView in compliance with TradingView's community guidelines and house rules. All users must adhere to TradingView's terms of service when using this indicator.
Document Version: 1.0
Publisher: aiTrendview
________________________________________
Disclaimer
The content provided in this blog post is for educational and training purposes only. It is not intended to be, and should not be construed as, financial, investment, or trading advice. All charting and technical analysis examples are for illustrative purposes. Trading and investing in financial markets involve substantial risk of loss and are not suitable for every individual. Before making any financial decisions, you should consult with a qualified financial professional to assess your personal financial situation.
Buscar en scripts para "pivot points"

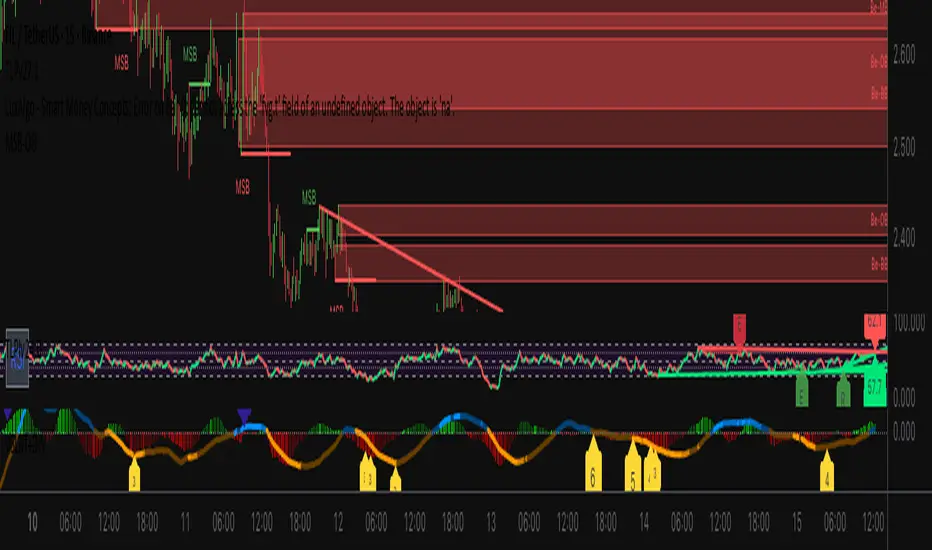
VSLRT with DivergencesOverview
This indicator combines Volume-Synchronized Linear Regression Trend (VSLRT) analysis with multi-indicator divergence detection to provide comprehensive market momentum and reversal signals. It displays volume-weighted price trends in both short-term and long-term timeframes, while simultaneously detecting divergences across 10 different technical indicators.
Key Features
VSLRT (Volume-Synchronized Linear Regression Trend):
Short-term and long-term trend analysis using linear regression
Volume-weighted calculations that account for buying vs selling pressure
Color-coded histogram showing trend strength and direction
Forecast projection showing anticipated trend continuation
Divergence-adjusted forecasting for enhanced prediction accuracy
Multi-Indicator Divergence Detection:
The indicator simultaneously monitors divergences across:
MACD (Moving Average Convergence Divergence)
MACD Histogram
RSI (Relative Strength Index)
Stochastic Oscillator
CCI (Commodity Channel Index)
Momentum
OBV (On-Balance Volume)
Volume-Weighted MACD
Chaikin Money Flow
Money Flow Index
Divergence Types:
Regular Bullish Divergence (potential reversal to upside)
Regular Bearish Divergence (potential reversal to downside)
Hidden Bullish Divergence (trend continuation upward)
Hidden Bearish Divergence (trend continuation downward)
How It Works
VSLRT Calculations:
The indicator calculates linear regression slopes for both price and volume, separating buying volume from selling volume. The histogram displays:
Green columns: Bullish price movement with strong buying volume
Red columns: Bearish price movement with strong selling volume
Shaded columns: Weaker conviction in the current trend
Thick line: Long-term trend direction
Divergence Detection:
The script automatically scans for divergences by comparing:
Price action (higher highs/lower lows)
Indicator values at pivot points
When price and indicators move in opposite directions, a divergence is detected
Divergences are displayed as labels on the histogram showing:
Which indicators are diverging
Number of simultaneous divergences (stronger signal when multiple indicators agree)
Color-coded by divergence type
Customizable Settings
VSLRT Settings:
Short-term length (default: 20)
Long-term length (default: 50)
Forecast bars (1-50, default: 10)
Divergence forecast adjustment factor
Custom colors for all trend states
Divergence Settings:
Pivot period for divergence detection
Source (Close or High/Low)
Divergence type (Regular, Hidden, or Both)
Minimum number of divergences to display
Maximum pivot points and bars to check
Toggle individual indicators on/off
Custom colors for each divergence type
Label display options (Full names, First letter, or Don't show)
Show divergence count option
Trading Applications
Trend Following:
Use VSLRT histogram to identify trend direction and strength
Enter trades when short-term and long-term trends align
Monitor forecast bars for potential trend continuation
Reversal Trading:
Watch for multiple regular divergences (3+ indicators)
Confirm with VSLRT color changes
Higher divergence count = stronger reversal signal
Trend Continuation:
Hidden divergences suggest trend will continue
Use during pullbacks in strong trends
Combine with VSLRT forecast for entry timing
Risk Management:
Divergence alerts can signal potential exits
VSLRT color changes can indicate stop-loss levels
Forecast helps anticipate trend exhaustion
Alert Conditions
Built-in alert conditions for:
Positive Regular Divergence Detected
Negative Regular Divergence Detected
Positive Hidden Divergence Detected
Negative Hidden Divergence Detected
Any Positive Divergence
Any Negative Divergence
Tips for Best Results
Multiple Timeframe Analysis: Check divergences on higher timeframes for more reliable signals
Confirmation: Wait for bar close (enabled by default) to avoid false signals
Volume Context: Stronger VSLRT signals occur during high volume periods
Divergence Count: More simultaneous divergences = higher probability signal
Trend Alignment: Best results when divergences align with overall trend direction
Strong PivotsThis finds pivots based on your inputs (number of candles back and forward that are above or below the range of the potential pivot points) and then optionally changes the color to help you visually identify the pivot. You can also specify pivots as strong pivots if they reverse in 1 time segment beyond a certain percentage (wick % of full candle range).
For example, if the pivot is at a high point but has a green body candle and a wick > 35% of the candle, it will change the body color to red to help visually understand that the candle can be considered a strong part of the downtrend, regardless of it closing green. This will help your mind interpret the top pivot candle as part of the potential trend reversal for the following candles and could even be used as part of your strategy ruleset.

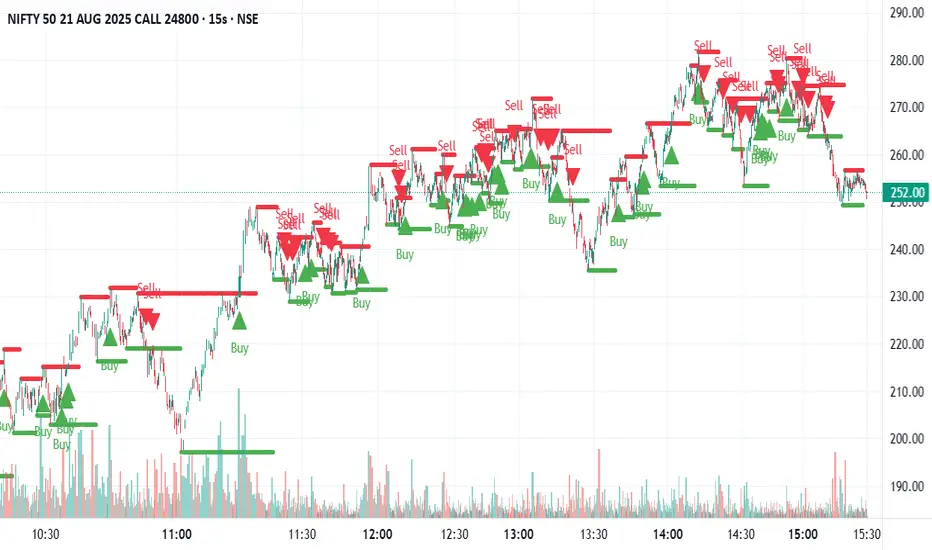
Ultimate Sniper Entry - Pivot PerfectionT2R📌 Description
The Ultimate Sniper Entry – Pivot Perfection is a precision trading tool designed to identify high-probability pivot points and generate early buy/sell entries with strong confirmation. By combining pivot detection, volume spikes, momentum filters (RSI), candle patterns, and EMA trend alignment, this system helps traders capture market reversals and trend continuation setups with improved accuracy.
It offers:
Smart Pivot Detection with adjustable sensitivity.
Multi-layer Confirmation: volume, momentum, candle structure, and EMA trend filter.
Non-Repainting Signals: arrows plotted only after pivot confirmation.
Visual Aids: buy/sell arrows, optional pivot markers, background trend shading.
Alerts: instant notifications for sniper buy/sell entries.
Info Panel: quick reference guide directly on chart.
Ideal for traders who want structured, rules-based entries while avoiding false signals, the Ultimate Sniper Entry system adapts to multiple markets and timeframes.

Swing Support and Resistance [Vijay]Swing-based support & resistance with breakout buy/sell signals and alerts.
Full Description:
The Swing Support and Resistance indicator is a simple yet effective tool to identify swing-based support and resistance levels using pivot points.
Pivot Length: Defines how many bars on each side are used to confirm a swing high (resistance) or swing low (support).
Support & Resistance: Plots the most recent pivot levels as visual markers (circles) on the chart.
Buy & Sell Signals:
A Buy Signal is triggered when price crosses above the last resistance.
A Sell Signal is triggered when price crosses below the last support.
Visual Cues: Arrows are plotted directly on the chart for easy signal recognition.
Alerts: Built-in alert conditions allow you to set TradingView alerts for breakout signals.
This script is useful for traders who rely on price action, breakout trading, and swing structure analysis. It helps quickly spot where price is breaking key levels and provides instant alerts for trade opportunities.
Futures Support & Resistance LevelsMulti-Timeframe Support & Resistance Levels for Futures Trading
Description:
This indicator automatically identifies and displays key support and resistance levels using multiple technical analysis methods. Designed specifically for futures traders (ES, NQ, etc.), it provides a clean, organized view of important price levels.
Key Features:
Multiple Detection Methods: Combines pivot points, daily ranges, and psychological levels
Smart Ranking System: Levels are numbered by strength (1 = strongest)
Clean Visualization: Extended lines across the chart with clear price labels
Confluence Detection: Highlights areas where multiple levels converge
Customizable Display: Adjust colors, line styles, and label sizes
Level Types Identified:
Daily High/Low (current session)
Previous Daily High/Low
Pivot-based Support/Resistance
Psychological Round Numbers
Confluence Zones (multiple levels clustering)
Technical Approach:
The indicator uses a strength-scoring algorithm to rank levels by importance. Daily levels receive the highest weighting (2.0), followed by previous daily levels (1.5), pivot points (1.0), and psychological levels (0.5). This helps traders focus on the most significant levels.
Visual Elements:
Solid lines = Strong levels
Dashed lines = Medium levels
Dotted lines = Weak levels
Optional technical condition markers for educational analysis
Best Used For:
Identifying key intraday levels for futures trading
Finding high-probability reversal zones
Setting logical stop-loss and take-profit levels
Recognizing confluence areas for stronger setups
Note:
This is a technical analysis tool for educational purposes. No indicator can predict future price movements. Always use proper risk management and combine with other forms of analysis.

cd_cisd_market_CxHi Traders,
Overview:
Many traders follow market structure to identify the market direction and seek trade opportunities in line with the trend.
However, markings derived from user-defined inputs can create different structures, depending on personal choices. For instance, choosing a pivot distance of 3 instead of 2 alters the structure, even though the chart remains the same. Ideally, the structure should remain consistent.
"Change in State Delivery" ( CISD ) is a widely accepted concept among traders and is considered a significant indicator of market direction based on the gain/loss of CISD levels.
In this indicator, CISD is selected as the primary criterion for marking market structure, eliminating the influence of user-dependent variations.
Here is a summary of the key logic and rules applied:
• When the price forms a new high/low, that level is only considered a pivot if a CISD has occurred.
• A bullish CISD is always followed by a bearish CISD, and vice versa.
• Pivot points form the internal structure.
• The internal structure is used to interpret the swing structure.
• Probabilities are derived from internal structure patterns.
________________________________________
Details:
How is CISD determined?
As is commonly known:
• When price makes a new high, the opening level of the first candle in the consecutive bullish candle sequence is marked.
• When price makes a new low, the opening of the first candle in the consecutive bearish sequence is marked.
• If there’s only one candle in the sequence, its opening level is used.
In a bullish market, losing a bearish CISD level (i.e., a close below it) or in a bearish market, gaining a bullish CISD level (i.e., a close above it) is interpreted as a potential shift in buyer-seller dominance and a possible market reversal.
________________________________________
How are internal (pivot) levels determined?
• When price closes below a bearish CISD level, the highest candle's high becomes a pivot high (PH).
• When price closes above a bullish CISD level, the lowest candle's low becomes a pivot low (PL).
• If the new PH is above the previous PH, it’s labeled as HH (Higher High); otherwise, LH (Lower High).
• If the new PL is below the previous PL, it’s labeled as LL (Lower Low); otherwise, HL (Higher Low).
________________________________________
Internal Market Structure:
• A series of HHs indicates a bullish internal structure.
• A series of LLs indicates a bearish internal structure.
________________________________________
Swing (Main) Market Structure:
Using internal pivots and previous swing levels, the main market structure is derived.
• A new swing high (SH) requires the price to move above the previous SH.
• A new swing low (SL) requires the price to move below the previous SL.
________________________________________
Probability Calculation:
Pivot levels forming the internal structure are coded as five-element sequences.
There are 64 possible combinations of such sequences made from consecutive PH and PL values.
Each pattern’s frequency from its starting candle is tracked.
To make it more understandable:
For example, after the four-sequence “HH, LL, LH,HL”, either HH or LH might follow.
The table shows the statistical likelihood of both possible outcomes for the most recent four-element sequence on the chart.
________________________________________
How reliable is it?
To assess reliability, results are calculated from the beginning using:
Success Rate (Suc. Rt) = Number of Correct Predictions / Total Predictions
This value is added to the table for reference.
It’s important to note that no statistical outcome guarantees certainty—every result offers a different interpretation. What truly matters is to avoid getting stopped out 😊.
________________________________________
Menu Options:
Show/hide preferences and color selections can be customized via the indicator menu.
________________________________________
What’s Coming in Future Versions?
Features such as FVG (Fair Value Gaps) between swing levels, volume imbalances, order blocks / mitigation blocks, Fibonacci levels, and relevant trade suggestions will be added.
________________________________________
This is a BETA version that I believe will help simplify your market reading. I’d be happy to hear your feedback and suggestions.
Cheerful Trading!

Murrey Math Lines v6Murrey Math Lines v6
This is not just another Murrey Math indicator. It's a complete, ground-up modernization of the classic concept, rebuilt with the latest Pine Script features for unparalleled performance, accuracy, and usability. While preserving the core mathematical genius of T.H. Murrey's system, this version introduces a suite of modern tools designed for today's trader.
What are Murrey Math Lines?
Murrey Math Lines (MML) are a powerful system of support and resistance based on geometric formulas developed by T.H. Murrey. As a derivation of W.D. Gann's observations, Murrey's geometry simplifies Gann's theories into a more accessible application. The core principle is that price action tends to trend and retrace in 1/8th intervals.
These intervals create a "trading octave" with distinct levels, each having its own characteristic behavior:
& - Ultimate Resistance & Support: These lines are the hardest to break. They represent the top and bottom of the expected price range and are prime areas for reversals.
- Major Pivot: This is the most significant level, offering the strongest support and resistance within the octave. Price has a high probability of stopping and reversing here.
& - Strong Pivot/Reversal: These are strong, secondary pivot points where price often struggles to pass through.
& - The Trading Range: The price tends to consolidate between these two lines about 50% of the time. A decisive break outside this range often signals the start of a new trend.
& - Weak Support/Resistance: These levels are weaker, but when price moves too quickly towards them, they can act as initial stopping points or areas for a minor reversal.
& - Extended Octave: These lines show extreme overbought and oversold conditions beyond the primary 0/8 to 8/8 octave.
Modern Enhancements in This Version
Session-Locked Precision: Anchor the Murrey Lines to the start of a specific trading session (e.g., NYSE open). The levels remain constant for the entire session, providing a stable and reliable framework for your daily analysis.
Visual Trading & Reversal Zones: Instead of just lines, this indicator can fill the key trading range (3/8 to 5/8) and reversal zones (0/8-1/8 & 7/8-8/8) with color, giving you an instant visual reference of market sentiment.
Dynamic "Closest Price" Labels: Declutter your chart! The indicator can intelligently display only the label for the Murrey level closest to the current price, keeping your view clean while providing critical information at a glance.
Integrated Alert System: Never miss a key level touch again. Set up alerts for when the price approaches major lines, the trading range, or all lines, customized to your trading style.
Advanced Pine Script Engine: Built on a modern codebase using User-Defined Types and dynamic drawing objects (line, box, label). This ensures the indicator is fast, efficient, and non-repainting, even on lower timeframes.
Intuitive User Interface: Settings are neatly organized into collapsible groups with clear tooltips, making it incredibly easy to customize every aspect of the indicator, from calculation parameters to colors.
A Note on Accuracy
Some of the other Murrey Math indicators on TradingView use different formulas and therefore produce varying results. This version has been carefully checked against MML indicators on other professional platforms to ensure its calculations are accurate and reliable.
Credits
This indicator is a complete overhaul and modernization of the original "MM Lines " script. Full credit for the original calculation logic and concept goes to its author, JRL_6.

Resistance Breakout LevelsResistance Breakout Levels
An advanced TradingView indicator that detects significant resistance pivots and marks confirmed breakouts.
Description:
This Pine Script automatically identifies swing-high pivot points as potential resistance levels. It confirms a breakout only after a configurable number of consecutive closes above the pivot, reducing noise and avoiding false signals. Once validated, it draws a horizontal breakout line at the pivot price and adds a label with the breakout value. Traders can choose to display all breakout lines or only the single highest breakout within a specified lookback period. Additionally, a dynamic current price line spans the chart for quick reference.
Features:
• Pivot High Detection for Resistance Levels
• N-Consecutive Close Breakout Confirmation
• Toggle Between All Breakouts or Highest Breakout with Lookback Window
• Full-Width Live Current Price Line
• Customizable Line Colors, Widths, and Extension Direction
• Price Labels Directly on Breakout Lines
User Inputs:
• Pivot Bars (Left/Right): Number of bars used to detect pivot highs
• Consecutive Closes Above: Closes required above pivot to confirm breakout
• Show All Breakouts: Option to plot every confirmed breakout line
• Highest Lookback Bars: Lookback window for retaining only the highest breakout
• Breakout Line Color & Width: Customize breakout line appearance
• Price Line Color & Width: Customize live current price line appearance

Smart Range DetectorSmart Range Detector
What It Does
This indicator automatically detects and validates significant trading ranges using pivot point analysis combined with logarithmic fibonacci relationships. It operates by identifying specific pivot patterns (High-Low-High and Low-High-Low) that meet fibonacci validation criteria to filter out noise and highlight only the most reliable trading ranges. Each range is continuously monitored for potential mitigation (breakout) events.
Key Features
Identifies both High-Low-High and Low-High-Low range patterns
Validates each range using logarithmic fibonacci relationships (more accurate than linear fibs)
Detects range mitigations (breakouts) and visually differentiates them
Shows fibonacci levels within ranges (25%, 50%, 75%) for potential reversal points
Visualizes extension levels beyond ranges for breakout targets
Analyzes volume profile with customizable price divisions (default: 60)
Displays Point of Control (POC) and Value Area for traded volume analysis
Implements performance optimization with configurable range limits
Includes user-adjustable safety checks to prevent Pine Script limitations
Offers fully customizable colors, line widths, and transparency settings
How To Use It
Identify Valid Ranges : The indicator automatically detects and highlights trading ranges that meet fibonacci validation criteria
Monitor Fibonacci Levels : Watch for price reactions at internal fib levels (25%, 50%, 75%) for potential reversal opportunities
Track Extension Targets : Use the extension lines as potential targets when price breaks out of a range
Analyze Volume Structure : Enable the volume profile mode to see where most volume was traded within mitigated ranges
Trade Range Boundaries : Look for reactions at range highs/lows combined with volume POC for higher probability entries
Manage Performance : Adjust the maximum displayed ranges and history bars settings for optimal chart performance
Settings Guide
Left/Right Bars Look Back : Controls how far back the indicator looks to identify pivot points (higher values find more ranges but may reduce sensitivity)
Max History Bars : Limits how far back in history the indicator will analyze (stays within Pine Script's 10,000 bar limitation)
Max Ranges to Display : Restricts the total number of ranges kept in memory for improved performance (1-50)
Volume Profile : When enabled, shows volume distribution analysis for mitigated ranges
Volume Profile Divisions : Controls the granularity of the volume analysis (higher values show more detail)
Display Options : Toggle visibility of range lines, fibonacci levels, extension lines, and volume analysis elements
Transparency & Color Settings : Fully customize the visual appearance of all indicator elements
Line Width Settings : Adjust the thickness of lines for better visibility on different timeframes
Technical Details
The indicator uses logarithmic fibonacci calculations for more accurate price relationships
Volume profile analysis creates 60 price divisions by default (adjustable) for detailed volume distribution
All timestamps are properly converted to work with Pine Script's bar limitations
Safety checks prevent "array index out of bounds" errors that plague many complex indicators
Time-based coordinates are used instead of bar indices to prevent "bar index too far" errors
This indicator works well on all timeframes and instruments, but performs best on 5-minute to daily charts. Perfect for swing traders, range traders, and breakout strategists.
What Makes It Different
Most range indicators simply draw boxes based on recent highs and lows. Smart Range Detector validates each potential range using proven fibonacci relationships to filter out noise. It then adds sophisticated volume analysis to help traders identify the most significant price levels within each range. The performance optimization features ensure smooth operation even on lower timeframes and extended history analysis.

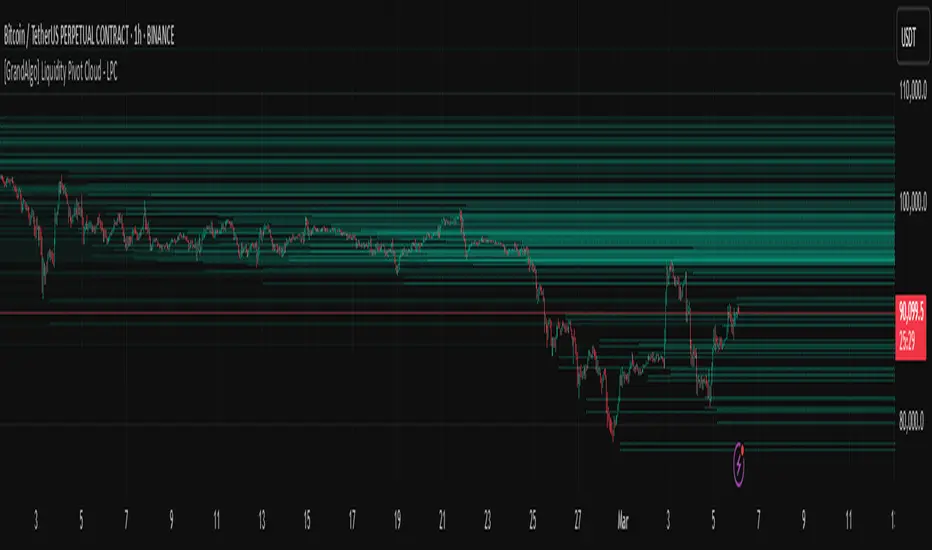
[GrandAlgo] Liquidity Pivot Cloud - LPCLiquidity Pivot Cloud (LPC) is a visualization tool that extends all pivot levels to the right, creating a structured liquidity map across the chart. Instead of treating pivot points as static levels, LPC transforms them into a dynamic cloud, highlighting key areas where price has historically reacted.
Key Features:
Extended Pivot Levels – Automatically stretches all pivot highs and lows, forming a continuous liquidity zone.
Clear Structure – Provides an organized view of price action, making it easy to identify reaction zones.
Dynamic Liquidity Map – Helps traders spot potential liquidity sweeps and areas of price absorption.
How to Use:
Identify Liquidity Zones – Areas with multiple overlapping pivots signal strong liquidity pools.
Look for Reactions – Price often consolidates, wicks, or reverses around extended pivot clouds.
Combine with Confluence – Use alongside Fair Value Gaps, Institutional Price Blocks, or Market Structure shifts for higher probability setups.
LPC aligns with smart money concepts by revealing key liquidity areas where stop hunts, liquidity grabs, and institutional activity are likely to occur. It helps traders see where price is likely to be drawn before a major move, making it a valuable tool for those trading liquidity-based strategies.
Auto Fib Retracement [victhoreb]Auto Fib Retracement is an automated Fibonacci retracement tool for TradingView that dynamically identifies key swing points and plots Fibonacci levels to help traders visualize potential support and resistance areas. Using a Zigzag algorithm, the indicator detects recent pivot highs and lows and calculates retracement levels based on these significant price swings. Key features include:
- Dynamic Pivot Detection: Automatically identifies recent swing highs and lows using configurable lookback periods, ensuring the Fibonacci levels adjust as the market evolves.
- Customizable Fibonacci Levels: Users can tailor the Fibonacci retracement levels (0, 0.214, 0.382, 0.5, 0.618, 0.786,) along with individual colors, offering flexibility to match various trading strategies.
- Zigzag Visualization: Optionally displays a Zigzag line that connects the detected pivot points, providing a clear visual representation of the price swing dynamics.
- Adjustable Line Extension: Retracement lines can be extended for a specified number of bars.
- Repainting Option: Includes an option to repaint the Zigzag, ensuring that the most current price action is reflected in the indicator’s output.
- The Auto Fibonacci Retracement itself DOES NOT REPAINT : )
This indicator streamlines the analysis process by automatically drawing Fibonacci retracement levels, allowing traders to quickly identify potential reversal areas and make more informed trading decisions.

LibraryDivergenceV6LibraryDivergenceV6
Enhance your trading strategies with LibraryDivergenceV6, a comprehensive Pine Script library designed to simplify and optimize the detection of bullish and bearish divergences across multiple technical indicators. Whether you're developing your own indicators or seeking to incorporate robust divergence analysis into your trading systems, this library provides the essential tools and functions to accurately identify potential market reversals and continuations.
Overview
LibraryDivergenceV6 offers a suite of functions that detect divergences between price movements and key technical indicators such as the Relative Strength Index (RSI) and On-Balance Volume (OBV). By automating the complex calculations involved in divergence detection, this library enables traders and developers to implement reliable and customizable divergence strategies with ease.
Key Features
Comprehensive Divergence Detection
Bullish Divergence: Identifies instances where the indicator forms higher lows while the price forms lower lows, signaling potential upward reversals.
Bearish Divergence: Detects situations where the indicator creates lower highs while the price forms higher highs, indicating possible downward reversals.
Overbought and Oversold Conditions: Differentiates between standard and strong divergences by considering overbought and oversold levels, enhancing signal reliability.
Multi-Indicator Support
RSI (Relative Strength Index): Analyze momentum-based divergences to spot potential trend reversals.
OBV (On-Balance Volume): Incorporate volume flow into divergence analysis for a more comprehensive market perspective.
Customizable Parameters
Pivot Points Configuration: Adjust the number of bars to the left and right for pivot detection, allowing fine-tuning based on different timeframes and trading styles.
Range Settings: Define minimum and maximum bar ranges to control the sensitivity of divergence detection, reducing false signals.
Noise Cancellation: Enable or disable noise filtering to focus on significant divergences and minimize minor fluctuations.
Flexible Usage
Exported Functions: Easily integrate divergence detection into your custom indicators or trading strategies with exported functions such as DivergenceBull, DivergenceBear, DivergenceBullOversold, and DivergenceBearOverbought.
Occurrence Handling: Specify which occurrence of a divergence to consider (e.g., most recent, previous) for precise analysis.
Optimized Performance
Efficient Calculations: Designed to handle multiple occurrences and pivot points without compromising script performance.
Line Management: Automatically creates and deletes trend lines based on divergence conditions, ensuring a clean and uncluttered chart display.

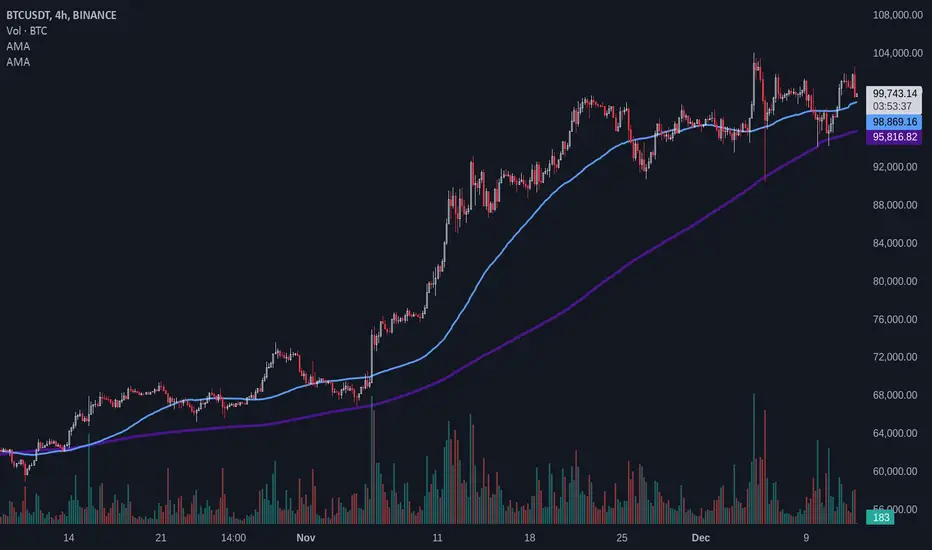
Adaptive MAAdaptive Moving Average (AMA)
Overview
The Adaptive Moving Average (AMA) script is designed to calculate and plot a moving average that adapts dynamically based on market conditions. This script uses pivot-based periods for its calculation, allowing it to adjust its behavior in response to market volatility and trends. It supports both Simple Moving Average (SMA) and Exponential Moving Average (EMA).
Features
Dynamic Period Calculation: Leverages the DynamicPeriodPublic library to compute periods based on pivot points, providing an adaptive length for the moving average.
Customizable Parameters: Users can choose predefined "Fast" and "Slow" settings or manually configure the parameters for greater control.
Supports SMA and EMA: Flexibility to choose between SMA and EMA for the moving average calculation.
Inputs
Source ( src ): Data source for the moving average (e.g., close price).
Default: close
Length Type ( length_type ): Determines the type of period calculation.
Options: Fast, Slow, Manual
MA Type ( ma_type ): Specifies the type of moving average to calculate.
Options: SMA, EMA
Manual Parameters (used when length_type is set to Manual):
Left Bars ( left_bars ): Number of left-hand bars for pivot detection.
Right Bars ( right_bars ): Number of right-hand bars for pivot detection.
Number of Pivots ( num_pivots ): Minimum number of pivots for dynamic period calculation.
Length Multiplier ( length_mult ): Multiplier applied to the calculated period.
Use Cases
Trend Analysis: Identify market trends with an average that adapts to changing conditions.
Volatility-Based Strategies: Adjust strategies dynamically in response to market volatility.
Custom Configurations: Fine-tune pivot parameters for specific markets or assets using the "Manual" mode.
Example Usage
Select the desired length type (Fast, Slow, or Manual).
If Manual is selected, configure the pivot detection parameters and length multiplier.
Choose the moving average type (SMA or EMA).
Observe the adaptive moving average plotted on the chart.
Fibonacci Cloud MTF [TrendX_]The Fibonacci Cloud MTF Indicator is an innovative trading tool crafted to assist traders in dynamically identifying key Fibonacci retracement levels. Unlike traditional methods that depend on static pivot points, this indicator effectively plots the Fibonacci golden zone - ranging from 0.382 to 0.618 - using the most recent highs and lows. This dynamic approach provides a more nuanced and responsive analysis of price movements, allowing traders to observe real-time reactions to significant Fibonacci levels. Furthermore, the indicator functions as a trend-following mechanism, signaling potential uptrends when the price crosses above the 0.618 fibonacci retracement level and indicating downtrends when it dips below.
💎 KEY FEATURES
Dynamic Fibonacci Levels: The indicator calculates Fibonacci retracement levels based on the latest highs and lows, providing a more relevant framework for current market conditions.
Golden Zone Focus: It emphasizes the Fibonacci golden zone (0.382 - 0.618), which is widely regarded as a critical area for potential reversals or continuations.
Multi-timeframe Analysis: The ability to view Fibonacci levels across multiple timeframes allows traders to identify trends and potential entry points more effectively.
Trend-Following Signals: Clear trend directions relative to the 0.618 level.
⚙️ USAGES
Identifying Key Retracement Levels: Traders can use the plotted Fibonacci levels to determine potential pullback or throwback at the key Fibonacci areas.
Trend Confirmation: By observing price interactions with the 0.618 level, traders can confirm ongoing trends and make more informed decisions about entering or exiting positions.
Multi-timeframe Strategies: The indicator allows traders to align strategies across different timeframes, improving overall trading effectiveness.
🔎 BREAKDOWN
Dynamic Fibonacci Levels: By calculating Fibonacci retracement levels from the latest highs and lows, traders receive a more accurate representation of current market sentiment. This dynamic approach ensures that the levels adapt to changing market conditions, making them more relevant for decision-making.
Golden Zone Focus: This highlights the Fibonacci golden zone, particularly the range between 0.382 and 0.618. This zone is widely regarded as a pivotal area for potential price reversals or continuations, serving as key support and resistance levels. Prices often react strongly at these points, making them crucial for pinpointing potential entry and exit opportunities in your trading strategy.
Multi-timeframe Analysis: Incorporating multi-timeframe analysis allows traders to observe how Fibonacci levels behave across different timeframes. This feature helps traders identify broader trends while also pinpointing short-term opportunities.
Trend-Following Strategies: Uptrend trigger - When the price crosses above the 0.618 level, it triggers uptrend, conversely, when the price crosses below the 0.618 level, it triggers a downtrend.
DISCLAIMER
This indicator is not financial advice, it can only help traders make better decisions. There are many factors and uncertainties that can affect the outcome of any endeavor, and no one can guarantee or predict with certainty what will occur. Therefore, one should always exercise caution and judgment when making decisions based on past performance.

Support, Resistance & Liquidity Pool ZonesSupport, Resistance & Liquidity Pool Zones
This indicator automatically detects and plots support and resistance levels based on pivot points and highlights liquidity pool zones, areas where the trading volume exceeds the average over a set number of bars. It is designed to help traders identify key price levels and liquidity traps that can trigger significant market reactions.
Key Features:
Support & Resistance Levels:
The indicator identifies pivot highs and pivot lows as potential resistance and support levels, respectively.
You can customize the number of levels shown on the chart, making it easier to focus on the most recent and relevant price levels.
Liquidity Pool Zones:
The script detects liquidity pool zones, which are areas with above-average trading volume. These zones often act as regions of interest where price accumulation or distribution occurs, potentially leading to significant price moves.
Liquidity zones are shaded to help traders visually identify areas of high interest in the market.
Customizable Settings:
You can adjust the pivot period to fine-tune how the indicator calculates support and resistance.
Control the number of support/resistance levels displayed on the chart and the period used to detect liquidity pools.
Customize the colors for support, resistance, and liquidity zones to match your charting preferences.
Alerts:
The script includes built-in alerts for when the price breaks above resistance or falls below support, helping traders catch key breakout opportunities.
How It Works:
The script calculates support and resistance levels using pivot highs and lows based on the user-defined pivot period.
It monitors liquidity pool zones by comparing the current trading volume with the average volume over a customizable period. When the volume exceeds the set threshold, a liquidity pool zone is highlighted, providing insight into where the market may accumulate or distribute.
Alerts are triggered when the price breaks above the first resistance level or falls below the first support level, giving traders immediate notification of key market events.
How to Use:
Tune the Pivot Period: Adjust the pivot period to your preferred time horizon (default: 10 bars).
Set Liquidity Pool Parameters: Customize the number of bars considered for liquidity pool detection and the volume multiplier to detect high-volume zones.
Monitor Breakouts: Use the built-in alerts to catch potential breakout or breakdown opportunities near support and resistance levels.
This script is ideal for traders looking for an easy-to-use tool to visualize support and resistance levels and liquidity pools, aiding in decision-making and trade management.

Fibonacci Pivot | SyedFibonacci pivots combine Fibonacci retracement levels with pivot points to provide potential support and resistance levels. This tool is based on the idea that price tends to retrace a predictable portion of a move, after which it often continues in the original direction.
Here’s a breakdown of Fibonacci pivots:
1. Pivot Point (PP)
The central level that acts as the main reference point for support and resistance levels. It’s calculated as the average of the high, low, and close of the previous period (typically a day).
Formula:
𝑃
𝑃
=
(
𝐻
𝑖
𝑔
ℎ
+
𝐿
𝑜
𝑤
+
𝐶
𝑙
𝑜
𝑠
𝑒
)
3
PP=
3
(High+Low+Close)
2. Fibonacci-Based Support and Resistance Levels
These levels are derived by multiplying the range (High - Low) of the previous period with key Fibonacci ratios (23.6%, 38.2%, 61.8%, etc.), then adding or subtracting this result from the Pivot Point.
The Fibonacci ratios used in Fibonacci pivots are typically:
38.2%: A strong retracement level.
61.8%: The golden ratio, a key Fibonacci level that often acts as major support or resistance.
100%: Full retracement from the previous period's high or low.
Fibonacci Support Levels (S1, S2, S3, etc.)
These levels indicate potential areas where the price might find support:
S1 = PP - (Range * 0.382)
S2 = PP - (Range * 0.618)
S3 = PP - (Range * 1)
Fibonacci Resistance Levels (R1, R2, R3, etc.)
These are the areas where price might face resistance:
R1 = PP + (Range * 0.382)
R2 = PP + (Range * 0.618)
R3 = PP + (Range * 1)
Interpretation
R1/R2/R3: Potential resistance levels where price might face selling pressure.
S1/S2/S3: Potential support levels where price might encounter buying interest.
Pivot Point (PP): Acts as the primary level of interest. If the price is above the PP, it suggests bullish sentiment; if below, bearish sentiment.
Example

Daily Liquidity Peaks and Troughs [ST]Daily Liquidity Peaks and Troughs
Description in English:
This indicator identifies peaks and troughs of highest liquidity on a daily timeframe by analyzing volume data. It helps traders visualize key points of high buying or selling pressure, which could indicate potential reversal or continuation areas.
Detailed Explanation:
Configuration:
Lookback Length: This input defines the period over which the highest high and lowest low are calculated. The default value is 14. This means the script will look at the past 14 bars to determine if the current high or low is a pivot point.
Volume Threshold Multiplier: This input defines the multiplier for the average volume. For example, a multiplier of 1.5 means the volume needs to be 1.5 times the average volume to be considered a significant peak or trough.
Peak Color: This input sets the color for liquidity peaks. The default color is red.
Trough Color: This input sets the color for liquidity troughs. The default color is green.
Volume Calculation:
Average Volume: The script calculates the simple moving average (SMA) of the volume over the lookback period. This helps to identify periods of significantly higher volume.
Volume Threshold: The threshold is determined by multiplying the average volume by the volume threshold multiplier. Only volumes exceeding this threshold are considered significant.
Identifying Peaks and Troughs:
Liquidity Peak: A peak is identified when the current high is the highest high over the lookback period and the current volume exceeds the volume threshold. This indicates a potential area of strong selling pressure.
Liquidity Trough: A trough is identified when the current low is the lowest low over the lookback period and the current volume exceeds the volume threshold. This indicates a potential area of strong buying pressure.
These peaks and troughs are marked on the chart with labels and shapes for easy visualization.
Plotting Peaks and Troughs:
Labels: The script uses labels to mark peaks and troughs on the chart. Peaks are marked with a red label and troughs with a green label.
Shapes: The script plots triangles above peaks and below troughs to highlight these areas visually.
Indicator Benefits:
Liquidity Identification: Helps traders identify key areas of high liquidity, indicating strong buying or selling pressure.
Visual Cues: Provides clear visual signals for potential reversal or continuation points, aiding in making informed trading decisions.
Customizable Parameters: Allows traders to adjust the lookback length and volume threshold to suit different trading strategies and market conditions.
Justification of Component Combination:
Peaks and Troughs Identification: Combining pivot points with volume analysis provides a robust method to identify significant liquidity areas. This helps in detecting potential market reversals or continuations.
Volume Analysis: Utilizing average volume and volume threshold ensures that only significant volume spikes are considered, enhancing the accuracy of identified peaks and troughs.
How Components Work Together:
The script first calculates the average volume over the specified lookback period.
It then checks each bar to see if it qualifies as a liquidity peak or trough based on the highest high, lowest low, and volume threshold.
When a peak or trough is identified, it is marked on the chart with a label and a shape, providing clear visual cues for traders.
Título: Picos e Fundos de Liquidez Diários
Descrição em Português:
Este indicador identifica picos e fundos de maior liquidez no gráfico diário, analisando os dados de volume. Ele ajuda os traders a visualizar pontos-chave de alta pressão de compra ou venda, o que pode indicar áreas potenciais de reversão ou continuação.
Explicação Detalhada:
Configuração:
Comprimento de Retrocesso: Este input define o período sobre o qual a máxima e mínima são calculadas. O valor padrão é 14. Isso significa que o script analisará os últimos 14 candles para determinar se a máxima ou mínima atual é um ponto de pivô.
Multiplicador de Limite de Volume: Este input define o multiplicador para o volume médio. Por exemplo, um multiplicador de 1.5 significa que o volume precisa ser 1.5 vezes o volume médio para ser considerado um pico ou fundo significativo.
Cor do Pico: Este input define a cor para os picos de liquidez. A cor padrão é vermelha.
Cor do Fundo: Este input define a cor para os fundos de liquidez. A cor padrão é verde.
Cálculo do Volume:
Volume Médio: O script calcula a média móvel simples (SMA) do volume ao longo do período de retrocesso. Isso ajuda a identificar períodos de volume significativamente mais alto.
Limite de Volume: O limite é determinado multiplicando o volume médio pelo multiplicador de limite de volume. Apenas volumes que excedem esse limite são considerados significativos.
Identificação de Picos e Fundos:
Pico de Liquidez: Um pico é identificado quando a máxima atual é a máxima mais alta no período de retrocesso e o volume atual excede o limite de volume. Isso indica uma potencial área de forte pressão de venda.
Fundo de Liquidez: Um fundo é identificado quando a mínima atual é a mínima mais baixa no período de retrocesso e o volume atual excede o limite de volume. Isso indica uma potencial área de forte pressão de compra.
Esses picos e fundos são marcados no gráfico com etiquetas e formas para fácil visualização.
Plotagem de Picos e Fundos:
Etiquetas: O script usa etiquetas para marcar picos e fundos no gráfico. Os picos são marcados com uma etiqueta vermelha e os fundos com uma etiqueta verde.
Formas: O script plota triângulos acima dos picos e abaixo dos fundos para destacar essas áreas visualmente.
Benefícios do Indicador:
Identificação de Liquidez: Ajuda os traders a identificar áreas-chave de alta liquidez, indicando forte pressão de compra ou venda.
Cues Visuais: Fornece sinais visuais claros para pontos potenciais de reversão ou continuação, auxiliando na tomada de decisões informadas.
Parâmetros Personalizáveis: Permite que os traders ajustem o comprimento de retrocesso e o limite de volume para se adequar a diferentes estratégias de negociação e condições de mercado.
Justificação da Combinação de Componentes:
Identificação de Picos e Fundos: A combinação de pontos de pivô com análise de volume fornece um método robusto para identificar áreas significativas de liquidez. Isso ajuda na detecção de potenciais reversões ou continuações de mercado.
Análise de Volume: Utilizar o volume médio e o limite de volume garante que apenas picos de volume significativos sejam considerados, aumentando a precisão dos picos e fundos identificados.
Como os Componentes Funcionam Juntos:
O script primeiro calcula o volume médio ao longo do período especificado de retrocesso.
Em seguida, verifica cada barra para ver se ela se qualifica como um pico ou fundo de liquidez com base

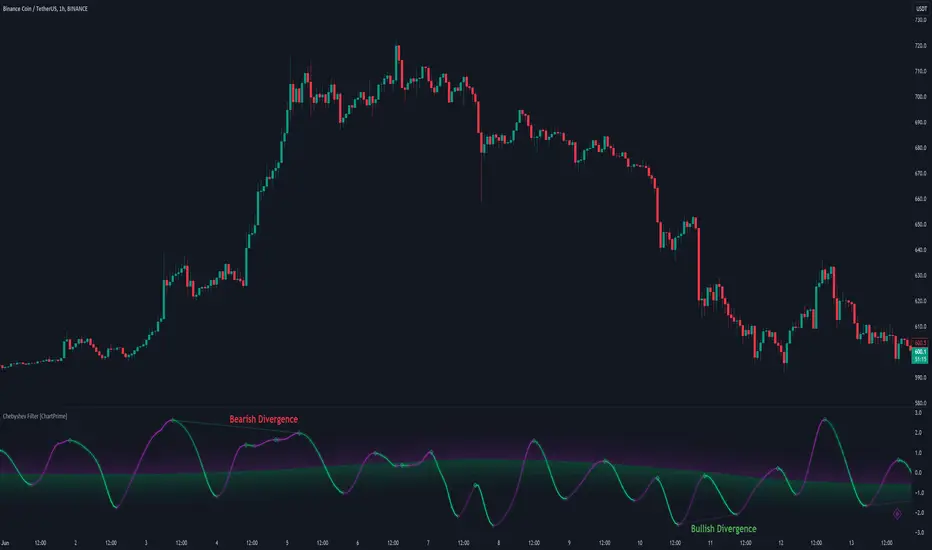
Chebyshev Filter Divergences [ChartPrime]The Chebyshev Filter Divergences Oscillator
The Chebyshev Filter indicator is a powerful tool designed to identify potential divergences between price and a filtered version of price based on the Chebyshev filter algorithm. It helps to spot mean reversion points by highlighting areas where price and the filtered price exhibit conflicting signals.
Chebyshev Filter Background:
The Chebyshev filter, named after the Russian mathematician Pafnuty Chebyshev , was invented in the mid-19th century. It's a type of filter used in signal processing and digital signal processing for smoothing or removing unwanted frequency components from a signal.
It provides a sharp cutoff between the passband and stopband of a filter while minimizing ripple in the passband or stopband.
Chebyshev filters are widely used in various applications, including audio and image processing, telecommunications, and financial analysis, due to their efficiency and effectiveness in filtering out noise and extracting relevant information from signals.
◆ Indicator Calculation:
The indicator first applies a Chebyshev filter to the price data, producing a filtered price series. It then normalizes this filtered price series to a range, where it can be used as oscillator with divergences.
◆ Visualization:
The filtered price series is plotted on the chart, highlighting areas where it deviates from its smoothed average.
Bullish and bearish divergences are marked on the chart with specific lines and colors, indicating potential shifts in market sentiment.
Signs of change in direction are also marked on the chart, providing additional insights into possible mean reversals of price.
◆ User Inputs:
Ripple (dB): Specifies the desired ripple factor in decibels for the Chebyshev filter.
Normalization Length: Sets the length of the normalization period used in the Chebyshev filter.
Pivots to Right and Left: Determines the number of pivot points to the right and left of the current point to consider when detecting divergences.
Max and Min of Lookback Range: Specifies the maximum and minimum lookback range for identifying divergences.
Show Divergences: Enables or disables the display of bullish and bearish divergences.
Visual Settings: Allows customization of colors for visual clarity.
In conclusion, the Chebyshev Filter Divergences indicator, with its ability to identify potential mean reversion points through divergences between price and a filtered version of price, offers traders a valuable tool for decision-making in the financial markets. By highlighting areas of divergence, traders can potentially capitalize on market inefficiencies and make more informed trading decisions.
Advanced Gold Scalping Strategy with RSI Divergence# Advanced Gold Scalping Strategy with RSI Divergence
## Overview
This Pine Script implements an advanced scalping strategy for gold (XAUUSD) trading, primarily designed for the 1-minute timeframe. The strategy utilizes the Relative Strength Index (RSI) indicator along with its moving average to identify potential trade setups based on divergences between price action and RSI movements.
## Key Components
### 1. RSI Calculation
- Uses a customizable RSI length (default: 60)
- Allows selection of the source for RSI calculation (default: close price)
### 2. Moving Average of RSI
- Supports multiple MA types: SMA, EMA, SMMA (RMA), WMA, VWMA, and Bollinger Bands
- Customizable MA length (default: 3)
- Option to display Bollinger Bands with adjustable standard deviation multiplier
### 3. Divergence Detection
- Implements both bullish and bearish divergence identification
- Uses pivot high and pivot low points to detect divergences
- Allows for customization of lookback periods and range for divergence detection
### 4. Entry Conditions
- Long Entry: Bullish divergence when RSI is below 40
- Short Entry: Bearish divergence when RSI is above 60
### 5. Trade Management
- Stop Loss: Customizable, default set to 11 pips
- Take Profit: Customizable, default set to 33 pips
### 6. Visualization
- Plots RSI line and its moving average
- Displays horizontal lines at 30, 50, and 70 RSI levels
- Shows Bollinger Bands when selected
- Highlights divergences with "Bull" and "Bear" labels on the chart
## Input Parameters
- RSI Length: Adjusts the period for RSI calculation
- RSI Source: Selects the price source for RSI (close, open, high, low, hl2, hlc3, ohlc4)
- MA Type: Chooses the type of moving average applied to RSI
- MA Length: Sets the period for the moving average
- BB StdDev: Adjusts the standard deviation multiplier for Bollinger Bands
- Show Divergence: Toggles the display of divergence labels
- Stop Loss: Sets the stop loss distance in pips
- Take Profit: Sets the take profit distance in pips
## Strategy Logic
1. **RSI Calculation**:
- Computes RSI using the specified length and source
- Calculates the chosen type of moving average on the RSI
2. **Divergence Detection**:
- Identifies pivot points in both price and RSI
- Checks for higher lows in RSI with lower lows in price (bullish divergence)
- Checks for lower highs in RSI with higher highs in price (bearish divergence)
3. **Trade Entry**:
- Enters a long position when a bullish divergence is detected and RSI is below 40
- Enters a short position when a bearish divergence is detected and RSI is above 60
4. **Position Management**:
- Places a stop loss order at the entry price ± stop loss pips (depending on the direction)
- Sets a take profit order at the entry price ± take profit pips (depending on the direction)
5. **Visualization**:
- Plots the RSI and its moving average
- Draws horizontal lines for overbought/oversold levels
- Displays Bollinger Bands if selected
- Shows divergence labels on the chart for identified setups
## Usage Instructions
1. Apply the script to a 1-minute XAUUSD (Gold) chart in TradingView
2. Adjust the input parameters as needed:
- Increase RSI Length for less frequent but potentially more reliable signals
- Modify MA Type and Length to change the sensitivity of the RSI moving average
- Adjust Stop Loss and Take Profit levels based on current market volatility
3. Monitor the chart for Bull (long) and Bear (short) labels indicating potential trade setups
4. Use in conjunction with other analysis and risk management techniques
## Considerations
- This strategy is designed for short-term scalping and may not be suitable for all market conditions
- Always backtest and forward test the strategy before using it with real capital
- The effectiveness of divergence-based strategies can vary depending on market trends and volatility
- Consider using additional confirmation signals or filters to improve the strategy's performance
Remember to adapt the strategy parameters to your risk tolerance and trading style, and always practice proper risk management.

Wyckoff Springs [QuantVue]The Wyckoff Springs indicator is designed to identify potential bullish reversal patterns known as "springs" in the Wyckoff Method. A Wyckoff spring occurs when the price temporarily dips below a support level, then quickly rebounds, suggesting a false breakdown and a
potential buying opportunity.
How it works:
Pivot detection:
The indicator identifies pivot lows based on the specified pivot length.
These pivot points are stored and analyzed for potential spring patterns.
Volume and Range Checks:
If volume confirmation is enabled, the indicator checks if the current volume exceeds a threshold based on the average volume over the specified period.
The indicator ensures that the price undercuts the defined trading range before confirming a spring pattern.
Spring Identification
The indicator checks for price conditions indicative of a Wyckoff spring: a temporary dip below a pivot low followed by a close above it. The recovery must take place within 3 bars.
If these conditions are met, a spring label is placed below the bar.
Features:
Pivot Length:
The user can set the pivot length to match any style of trading.
Volume Confirmation:
An optional feature where the user can specify if volume confirmation is required for a spring signal.
Volume threshold can be set to determine what constitutes significant volume compared to the average volume over a specified period. By default it is set to 1.5
How to Trade a Spring:
Give this indicator a BOOST and COMMENT your thoughts below!
We hope you enjoy.
Cheers!

Stop Hunts [MK]Liquidity rests above/below previous highs and lows because these are the areas where traders are most likely to leave their orders/stop losses. The market can tap into this liquidity source by going beyond the previous highs and lows, this liquidity can then be used to reverse the market in the opposite direction.
As traders we may want to know if price will continue beyond previous highs and lows, or reverse the market. If price looks to be reversing after tapping into liquidity, this can be a good area to enter a trade. The same area can be used as a take profit level also.
The indicator identifies previous high/lows in two ways:
1. previous high/lows using 'PIVOT POINTS'. Pivots are easy to spot and are obvious within a price trend. Also called 'higher highs", "lower lows" etc. The number of candles required to form the pivot point can be adjusted in the script settings.
see below example of pivot point and stop hunt:
www.tradingview.com
see how price reversed upwards after stop hunt on pivot point above.
2. previous candle high/lows. A previous candles high and low are also good areas of liquidity.
see below example of previous candle stop hunt:
see how price reversed upwards after stop hunt on previous candle low above.
Personally, I use the pivot point stop hunts on lower timeframes and previous candle stop hunts on higher timeframes. However users can adjust on which timeframes to show the indicator depending on their own trading style.
As ever all items within 'settings' are customizable.
The indicator is by no means a 'trading strategy' and users should be fully aware of the stop hunt concept and have conducted extensive back-testing before using with 'live' accounts.
The indicator may also serve as a 'teaching aid' to new students and as a reminder to more experienced traders.

Trailing Management (Zeiierman)█ Overview
The Trailing Management (Zeiierman) indicator is designed for traders who seek an automated and dynamic approach to managing trailing stops. It helps traders make systematic decisions regarding when to enter and exit trades based on the calculated risk-reward ratio. By providing a clear visual representation of trailing stop levels and risk-reward metrics, the indicator is an essential tool for both novice and experienced traders aiming to enhance their trading discipline.
The Trailing Management (Zeiierman) indicator integrates a Break-Even Curve feature to enhance its utility in trailing stop management and risk-reward optimization. The Break-Even Curve illuminates the precise point at which a trade neither gains nor loses value, offering clarity on the risk-reward landscape. Furthermore, this precise point is calculated based on the required win rate and the risk/reward ratio. This calculation aids traders in understanding the type of strategy they need to employ at any given time to be profitable. In other words, traders can, at any given point, assess the kind of strategy they need to utilize to make money, depending on the price's position within the risk/reward box.
█ How It Works
The indicator operates by computing the highest high and the lowest low over a user-defined period and then applying this information to determine optimal trailing stop levels for both long and short positions.
Directional Bias:
It establishes the direction of the market trend by comparing the index of the highest high and the lowest low within the lookback period.
Bullish
Bearish
Trailing Stop Adjustment:
The trailing stops are adjusted using one of three methods: an automatic calculation based on the median of recent peak differences, pivot points, or a fixed percentage defined by the user.
The Break-Even Curve:
The Break-Even Curve, along with the risk/reward ratio, is determined through the trailing method. This approach utilizes the current closing price as a hypothetical entry point for trades. All calculations, including those for the curve, are based on this current closing price, ensuring real-time accuracy and relevance. As market conditions fluctuate, the curve dynamically adjusts, offering traders a visual benchmark that signifies the break-even point. This real-time adjustment provides traders with an invaluable tool, allowing them to visually track how shifts in the market could impact the point at which their trades neither gain nor lose value.
Example:
Let's say the price is at the midpoint of the risk/reward box; this means that the risk/reward ratio should be 1:1, and the minimum win rate is 50% to break even.
In this example, we can see that the price is near the stop-loss level. If you are about to take a trade in this area and would respect your stop, you only need to have a minimum win rate of 11% to earn money, given the risk/reward ratio, assuming that you hold the trade to the target.
In other words, traders can, at any given point, assess the kind of strategy they need to employ to make money based on the price's position within the risk/reward box.
█ How to Use
Market Bias:
When using the Auto Bias feature, the indicator calculates the underlying market bias and displays it as either bullish or bearish. This helps traders align their trades with the underlying market trend.
Risk Management:
By observing the plotted trailing stops and the risk-reward ratios, traders can make strategic decisions to enter or exit positions, effectively managing the risk.
Strategy selection:
The Break-Even Curve is a powerful tool for managing risk, allowing traders to visualize the relationship between their trailing stops and the market's price movements. By understanding where the break-even point lies, traders can adjust their strategies to either lock in profits or cut losses.
Based on the plotted risk/reward box and the location of the price within this box, traders can easily see the win rate required by their strategy to make money in the long run, given the risk/reward ratio.
Consider this example: The market is bullish, as indicated by the bias, and the indicator suggests looking into long trades. The price is near the top of the risk/reward box, which means entering the market right now carries a huge risk, and the potential reward is very low. To take this trade, traders must have a strategy with a win rate of at least 90%.
█ Settings
Trailing Method:
Auto: The indicator calculates the trailing stop dynamically based on market conditions.
Pivot: The trailing stop is adjusted to the highest high (long positions) or lowest low (short positions) identified within a specified lookback period. This method uses the pivotal points of the market to set the trailing stop.
Percentage: The trailing stop is set at a fixed percentage away from the peak high or low.
Trailing Size (prd):
This setting defines the lookback period for the highest high and lowest low, which affects the sensitivity of the trailing stop to price movements.
Percentage Step (perc):
If the 'Percentage' method is selected, this setting determines the fixed percentage for the trailing stop distance.
Set Bias (bias):
Allows users to set a market bias which can be Bullish, Bearish, or Auto, affecting how the trailing stop is adjusted in relation to the market trend.
-----------------
Disclaimer
The information contained in my Scripts/Indicators/Ideas/Algos/Systems does not constitute financial advice or a solicitation to buy or sell any securities of any type. I will not accept liability for any loss or damage, including without limitation any loss of profit, which may arise directly or indirectly from the use of or reliance on such information.
All investments involve risk, and the past performance of a security, industry, sector, market, financial product, trading strategy, backtest, or individual's trading does not guarantee future results or returns. Investors are fully responsible for any investment decisions they make. Such decisions should be based solely on an evaluation of their financial circumstances, investment objectives, risk tolerance, and liquidity needs.
My Scripts/Indicators/Ideas/Algos/Systems are only for educational purposes!
